Figure 4.
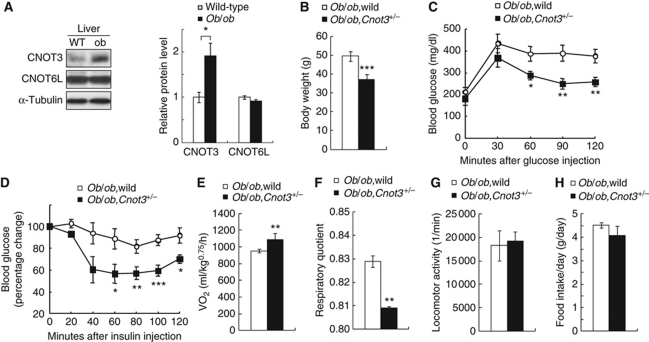
Improvement of obesity and insulin resistance in ob/ob;Cnot3+/− mice. (A) Increased expression of CNOT3 in the liver of ob/ob mice. Immunoblotting of CNOT3 and CNOT6L in wild-type and ob/ob mice (left), and quantification of the data (right). Levels were normalized to α-tubulin. n=3 for each genotype. (B) Decreased body weight in 12-week-old ob/ob,Cnot3+/− mice. n=10 for ob/ob mice. n=4 for ob/ob,Cnot3+/− mice. (C, D) Glucose (C) and insulin (D) tolerance tests. Blood glucose levels were measured at each indicated time point following intraperitoneal glucose or insulin injection. n=6 for ob/ob mice. n=4 for ob/ob,Cnot3+/− mice. (E–H) Comparison of average VO2 (E), respiratory quotient (F), locomotor activity (G), and average daily food intake (H) between ob/ob and ob/ob,Cnot3+/− mice. VO2 were normalized to body weight0.75. Respiratory quotient was calculated by carbon dioxide production/oxygen consumption. Daily food intake per mouse was measured over 7 days. All values represent mean±s.e.m. *P<0.05; **P<0.01 and ***P<0.001.

