Figure 7.
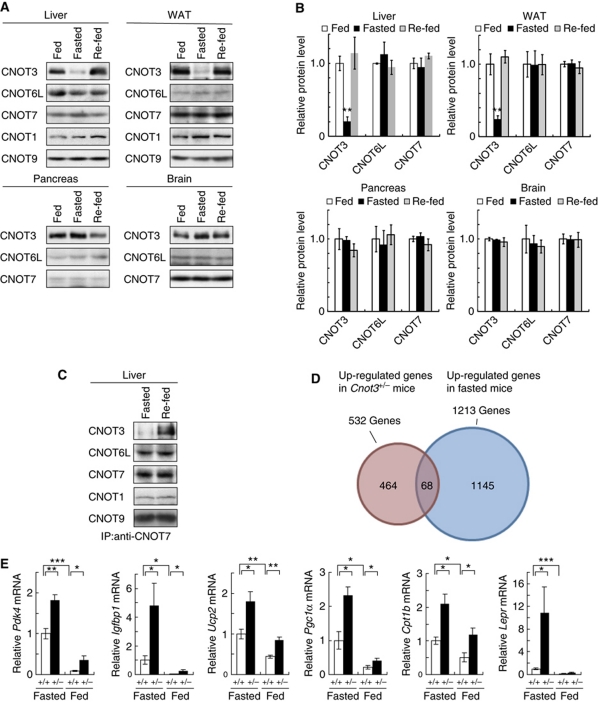
Alternation of CNOT3 expression level by responding to nutrient status and identification of CNOT3-regulated mRNAs. (A) Reduced expression of CNOT3 in the liver and WAT of fasted mice. Western blots of CNOT3 and other CCR4–NOT subunits expression in the liver, WAT, brain, and pancreas of mice fed ad libitum, 24 h fasted, and 24 h re-fed. (B) Quantification of the data is shown in (A). Ad libitum-fed, open columns; 24 h fasted, filled columns; and 24 h re-fed mice, semifilled columns. Levels were normalized to α-tubulin. n=3 for each condition. All values are mean±s.e.m. *P<0.01 versus fed mice. (C) Levels of CNOTs in the CCR4–NOT complex. Immunoblotting of the anti-CNOT7 immunoprecipitates prepared from the liver of mice fed ad libitum, 24 h fasted and 24 h re-fed. (D) Identification of genes regulated by CNOT3. Global gene expression profiling of liver RNAs was assessed for 8-week-old mice. Note that the data shown in Figure 5 were from the analysis of 12-week-old mice. Comparisons were made between wild-type and Cnot3+/− mice (circled red) and between feeding and fasted wild-type mice (circled blue). (E) Real-time PCR analysis of selected genes in the livers of 8-week-old wild-type and Cnot3+/− mice under fasting or feeding conditions (n=3–5 for each genotype). Data represent mean values±s.e.m. *P<0.05; **P<0.01 and ***P<0.001.

