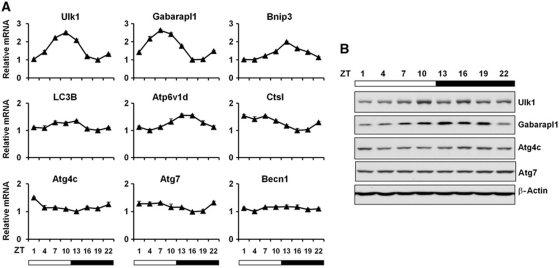
Figure 2.
Rhythmic induction of autophagy gene expression in the liver. (A) qPCR analysis of autophagy genes at different time points of mouse livers. Pooled samples from four mice were used for each time point. Data represent mean±s.d. of one of three independent studies. Becn1 serves as an example gene with modest diurnal oscillation at mRNA level. (B) Immunoblots of autophagy proteins in mouse livers at indicated time points. Pooled samples from four mice were used for each time point.

