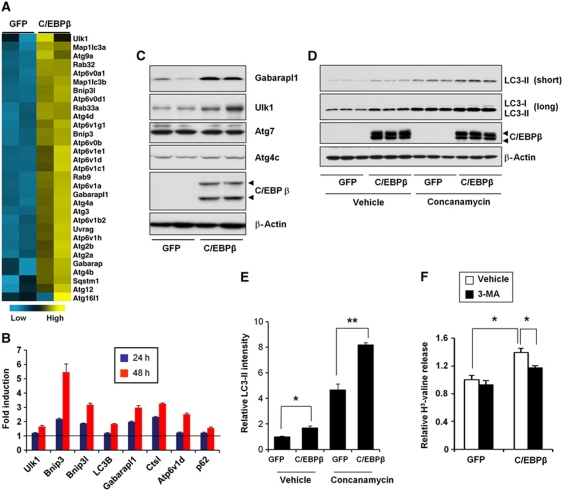
Figure 3.
Induction of autophagy gene expression and autophagy process by C/EBPβ. (A) Clustering analysis of autophagy-related genes in primary hepatocytes transduced with GFP or C/EBPβ adenoviruses for 48 h. Blue and yellow represent low and high mRNA expression, respectively. (B) qPCR analysis of autophagy gene expression. Fold induction by C/EBPβ in primary hepatocytes 24 h (blue) or 48 h (red) following adenoviral transduction is shown. Data represent mean±s.d. of one representative experiment. (C) Protein expression of autophagy genes in hepatocytes transduced with GFP or C/EBPβ adenoviruses. Arrowheads point to two C/EBPβ isoforms generated from alternative translation start sites. (D) Immunoblots of total lysates from transduced primary hepatocytes treated with vehicle or concanamycin in triplicates. Blots with different exposure time were shown to illustrate LC3-I and LC3-II signals. (E) Quantitation of LC3-II protein levels following normalization to β-actin. Data represent mean±s.e. Student's t-test was applied. *P<0.01; **P<0.001. (F) Protein degradation assay in transduced hepatocytes in the absence (open) or presence of 3-MA (filled). Note that C/EBPβ-inducible proteolysis is sensitive to 3-MA treatment. Student's t-test was applied. *P<0.05.

