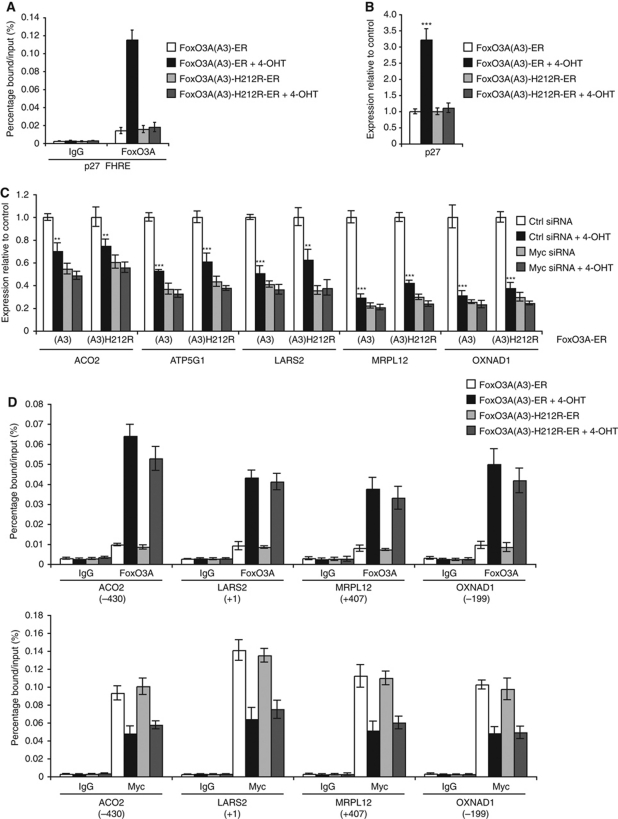
Figure 6.
Repression of hypoxia-repressed mitochondrial genes by an inducible FoxO3A allele is independent of binding to FHRE. (A) FoxO3A(A3)-ER or FoxO3A(A3)-H212R-ER stably expressing U2OS cell clones were incubated in the absence or presence of 250 nM 4-OHT for 2 h before crosslinking. ChIP was performed using anti-FoxO3A and IgG (negative control) antibodies. Binding of FoxO3A to an FHRE in the p27 promoter was analysed by qPCR and is presented as percentage bound/input. Error bars indicate mean±s.d. (B) FoxO3A(A3)-ER or FoxO3A(A3)-H212R-ER stably expressing U2OS cell clones were incubated in the absence or presence of 250 nM 4-OHT for 10 h. RNA was extracted and analysed by qPCR. The results are normalized to 18S rRNA and are shown as fold of normoxic Ctrl. Error bars indicate mean±s.d. of three experiments, ***P<0.001 using Student's t-test. (C) FoxO3A(A3)-ER or FoxO3A(A3)-H212R-ER stably expressing U2OS cell clones were transfected with Ctrl siRNA or siRNA against Myc 24 h prior to incubation in the absence or presence of 250 nM 4-OHT for 10 h. RNA was extracted and analysed by qPCR. The results are normalized to 18S rRNA and are shown as fold of Ctrl. Error bars indicate mean±s.d. of three experiments, **P<0.01, ***P<0.001 using Student's t-test. (D) The experiment was preformed as in (A). ChIP was performed using anti-FoxO3A, anti-Myc, and IgG (negative control) antibodies. Binding of FoxO3A (upper panel) and Myc (lower panel) to the peak areas of ACO2, LARS2, MRPL12, and OXNAD1 was analysed by qPCR and is presented as percentage bound/input. Error bars indicate mean±s.d.

