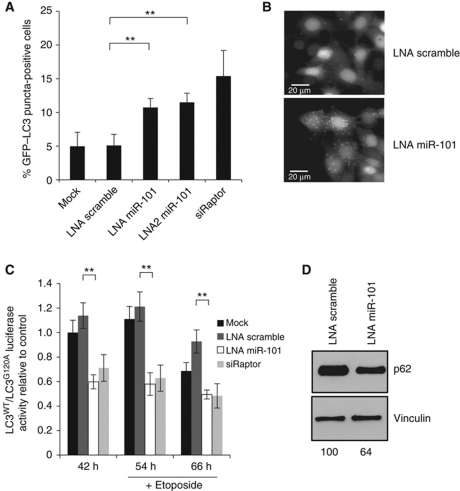
Figure 3.
Knockdown of endogenous miR-101 induces autophagy. (A) miR-101 inhibition induces eGFP–LC3 translocation. MCF-7 eGFP–LC3 cells were transfected with indicated LNAs or siRNAs and fixed 72 h post-transfection. Percentage of eGFP–LC3 puncta-positive cells was quantified using a threshold of >5 dots per cell. Data are shown as the mean±s.d. of five replicates and are representative of three independent experiments. **P<0.005. (B) Representative images from the quantification shown in (A). Scale bars represent 20 μM. (C) miR-101 inhibition induces autophagic flux. MCF-7 RLuc–LC3WT and RLuc–LC3G120A cells were reverse transfected with indicated LNAs or siRNAs and 42 h later 50 μM etoposide was added. Luciferase activity was measured at 42, 54 and 66 h after transfection. Data are shown as the mean±s.d. of three replicates and are representative of three independent experiments. **P<0.005. (D) miR-101 inhibition leads to decreased p62 expression. Western blot analysis 72 h after transfection with LNA miR-101 or LNA scramble. p62 bands were quantified relative to the vinculin loading control using ImageJ software and the relative quantifications are shown. The data are representative of three independent experiments.

