Figure 2.
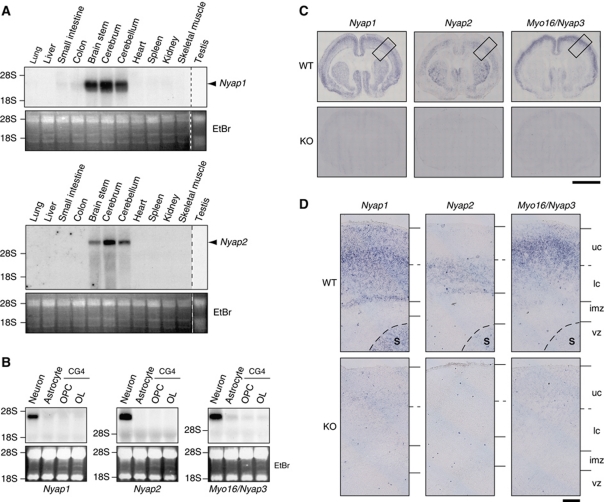
Neuron-specific expression of the NYAPs. (A) Northern blot analysis of Nyap1 and Nyap2 mRNA in mouse tissues. Vertical dashed lines represent boundaries between different gels. Ethidium bromide-stained images are shown in the lower panels as loading controls (EtBr). (B) Northern blot analysis of NYAPs mRNA in rat cortical neurons and astrocytes, as well as the rat CG4 oligodendrocyte cell line during precursor (OPC) and mature (OL) stages. (C) In situ hybridization analysis of NYAPs mRNA in postnatal day 1 (P1) mouse brains. Scale bar: 2 mm. (D) Magnified images of the boxed areas in (C). Wild-type (WT) P1 mouse brains (upper panels) and each of the Nyap1, 2, or 3 knockout P1 mouse brains (KO, lower panels) were hybridized with Nyap1, 2, or 3 mRNA probes. S, striatum; uc, upper cortical area; lc, lower cortical area; imz, intermediate zone; and vz, ventricular and subventricular zone. Scale bar: 200 μm.

