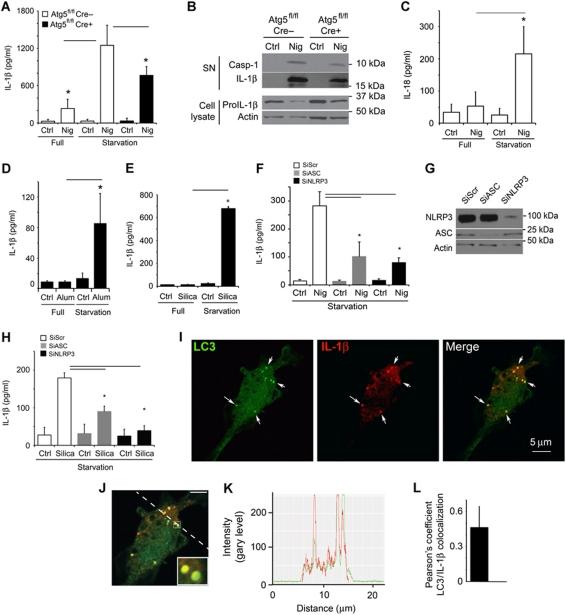
Figure 1.
Induction of autophagy enhances IL-1β secretion. (A) Atg5fl/fl Cre− and Atg5fl/fl Cre+ bone marrow-derived macrophages (BMMs), pretreated overnight with 100 ng/ml LPS, were stimulated for 1 h with the inflammasome agonist nigericin (20 μM) with (Starvation; EBSS) or without (Full; full medium) autophagic induction. Cell culture supernatants were assayed for murine IL-1β by ELISA. Data represent mean values±s.d. (n⩾3); *P<0.05. (B) LPS-pretreated Atg5fl/fl Cre− and Atg5fl/fl Cre+ BMMs were stimulated with 20 μM nigericin for 1 h in OptiMEM and the release of active caspase-1 and IL-1β was determined by immunoblotting. (C) As in (A), assayed for IL-18. Data represent mean values±s.d. (n⩾3); *P<0.05. (D) LPS-pretreated BMMs were exposed to alum (250 μg/ml) for 1 h with or without autophagic induction by starvation. Secreted IL-1β was measured as in (A). Data represent mean values±s.d. (n⩾3); *P<0.05. (E) LPS-pretreated BMMs were exposed to silica (250 μg/ml) for 1 h with or without autophagic induction by starvation. Secreted IL-1β was measured as in (A). Data represent mean values±s.d. (n⩾3); *P<0.05. (F) BMMs were transfected with scramble (Scr) control siRNA or siRNAs against ASC and NLRP3. After 48 h following transfection, cells were treated overnight with LPS and subjected to nigericin (20 μM) and starvation for 1 h. Data represent mean values±s.d. (n⩾3); *P<0.05. (G) Immunoblot analysis of ASC and NLRP3 knockdowns. (H) BMMs were transfected with scramble (Scr) control siRNA or siRNAs against ASC and NLRP3. After 48 h following transfection, cells were treated overnight with LPS and subjected to silica (250 μg/ml) and starvation for 1 h. Data represent mean values±s.d. (n⩾3); *P<0.05. (I) Colocalization of IL-1β with the basal autophagic machinery factor LC3. Fluorescence: LC3 (green, Alexa488); IL-1β (red, Alexa568). BMMs were from GFP–LC3 knock-in mice, treated with LPS then prepared for immunofluorescence microscopy using fluorescently labelled antibodies against GFP and IL-1β. (J, K) A line fluorescence tracing from images in (I). (L) Pearson's colocalization coefficient for IL-1β and LC3. Pearson's coefficient was derived from three independent experiments with five fields per experiment, for a total of 15 fields contributing to the cumulative result. Figure source data can be found in Supplementary data.

