Figure 5.
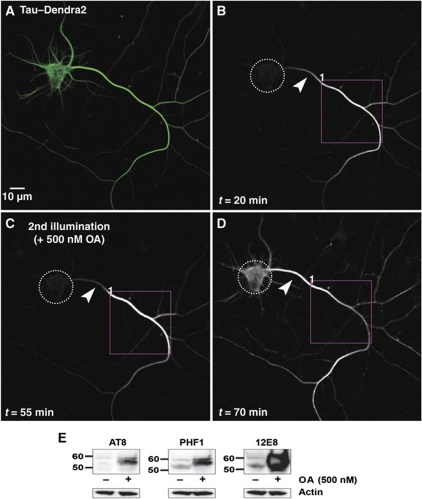
Hyperphosphorylation by okadaic acid (OA) treatment allows TauD2 to pass the barrier. (A) Green fluorescent image of a 9 DIV neuron expressing TauD2 before photoconversion. (B) Red fluorescent image of the same neuron where part of its axon was photoconverted (ROI1). Time-lapse image after 20 min showing the anterograde spreading of TauD2 but blockage at the AIS near the cell body (arrowheads in B–D indicate the AIS). (C) The same protocol of photoconversion as in (B) was repeated in the same axonal region (ROI1) 55 min after the first illumination; at this time, 500 nM OA was added. The diffusion barrier at the AIS is still visible (arrowhead). (D) Redistribution of axonal Tau to the somatodendritic compartment after OA treatment. Increasing fluorescence intensity in the soma is observed shortly after addition of OA, and the gradient in distribution of axonal Tau in the AIS disappears. Dashed circles indicate the soma in (B–D). (E) Western blot of extracts of cortical neurons (11 DIV) treated with OA (500 nM, 1 h) using phosphorylation-dependent Tau antibodies AT8, PHF1, and 12E8. The signals of hyperphosphorylated Tau increase strongly after phosphatases are inhibited by OA treatment (right lanes), especially in the case of 12E8 (pS262/pS356 in the repeats, right panel); whereas in the untreated cells the signals of phosphorylated Tau at these epitopes remain low (left lanes). Note the clear upward shift of the bands of phosphorylated Tau in the OA-treated cells. A blot with anti-actin antibody was used as loading control.

