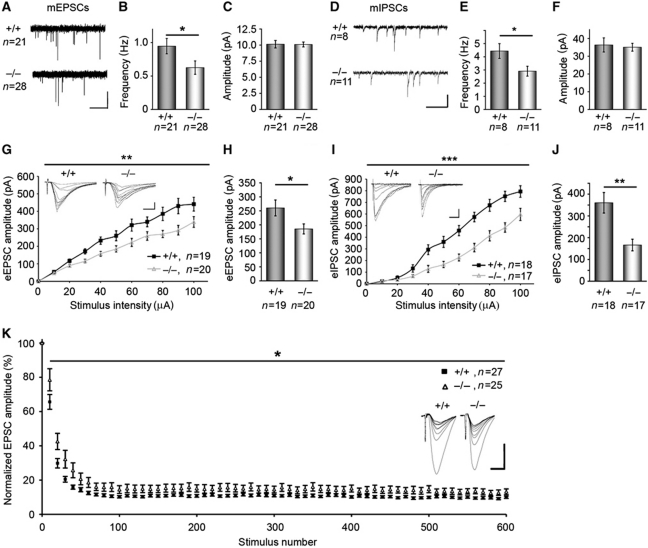
Figure 7.
Syndapin I KO causes defects in both excitatory and inhibitory synaptic transmission. mEPSCs (A–C) and mIPSCs (D–F) recorded from CA1 pyramidal neurons held at −60 mV. Representative traces are shown (mEPSCs, horizontal bar, 2.5 s; vertical bar, 10 pA; mIPSCs, horizontal bar, 0.5 s; vertical bar, 50 pA). The frequencies of both mEPSCs and mIPSCs were significantly reduced upon syndapin I KO (B, E), whereas the amplitudes were unchanged (C, F). Data represent mean±s.e.m. Statistical analysis, t-test; *P<0.05. (G–J) Measurement of eEPSCs (G; 19 and 20 slices of hippocampal CA1 regions from 9 (+/+) and 8 (−/−) animals) and eIPSCs (I; 18 and 17 slices from 9 (+/+) and 9 (−/−) animals). Inserts show example eEPSC and eIPSC traces (eEPSCs, horizontal bar, 10 ms; vertical bar, 100 pA; eIPSCs, horizontal bar, 100 ms; vertical bar, 200 pA). (H, J) eEPSC and eIPSC amplitudes, respectively, at 50 μA in WT and syndapin I KO. Data represent mean±s.e.m. Two-way repeated measures ANOVA; *P<0.05; **P<0.01; ***P<0.001. (K) Plots of evoked EPSCs in response to 600 stimuli at 40 Hz, normalized to the amplitude of the first EPSC and averaged by 10 show a significantly reduced EPSCs amplitude depression in syndapin I KO mice. Two-way repeated measures-ANOVA; *P<0.05. The inserts depict examples of mean EPSCs during the first 100 stimuli of the train, averaged over 10 consecutive recordings. Horizontal bar, 200 pA; vertical bar, 10 ms.

