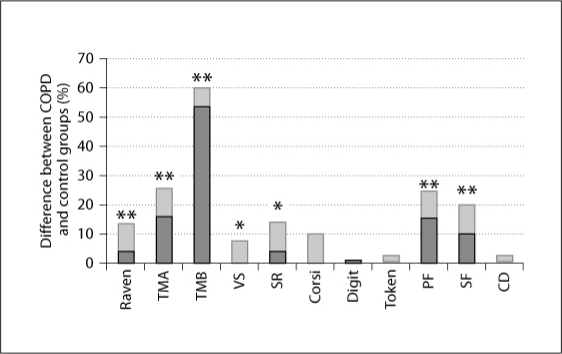
Fig. 1.
Differences in neuropsychological evaluation between COPD patients and controls. Each bar represents the mean ± SD percent difference compared to the controls. Raven = Raven's colored progressive matrices; TMA/TMB = trail making test part A/part B; VS = visual search; SR = story recall; Corsi = Corsi test; Digit = digit span test; Token = token test; PF = phonological fluency; SF = semantic fluency; CD = copying drawings. *p ≤ 0.05; ** p ≤ 0.01.

