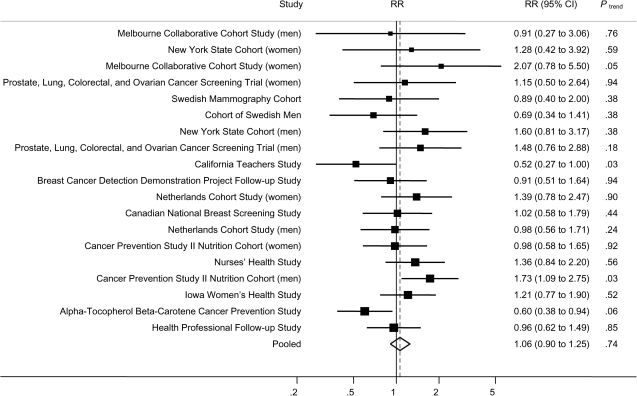
Figure 1.
Study-specific and pooled multivariable relative risks (RRs) of pancreatic cancer according to highest vs lowest quintile of dietary folate intake. The solid squares and horizontal lines correspond to the study-specific multivariable RRs and 95% confidence intervals (CIs), respectively. The area of the solid square reflects the study-specific weight (inverse of the variance). The open diamond represents the pooled multivariable RR and 95% CI. The dashed vertical line indicates the pooled RR. The solid vertical line indicates a RR of 1.0.

