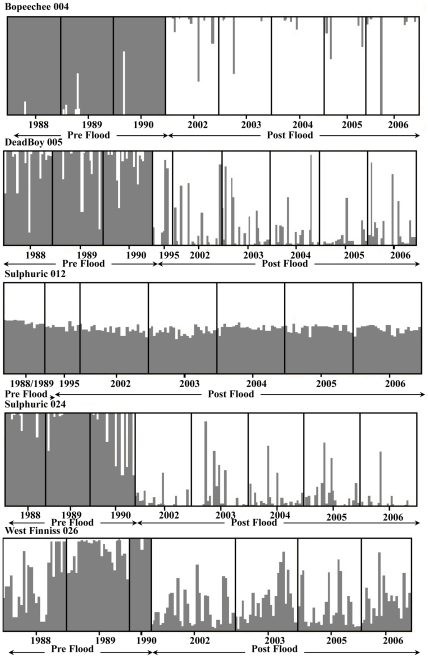
Figure 4. Results of the temporal assignment tests.
Temporal assignment of individuals to K = 2 inferred clusters from the STRUCTURE analysis across all historical and contemporary snail samples within each of the five study springs. Grey indicates pre flood years (1988–1990) and white post flood years (1995, 2002–2006).

