
Figure 3. A simplified model of the network shown in Figure 2.
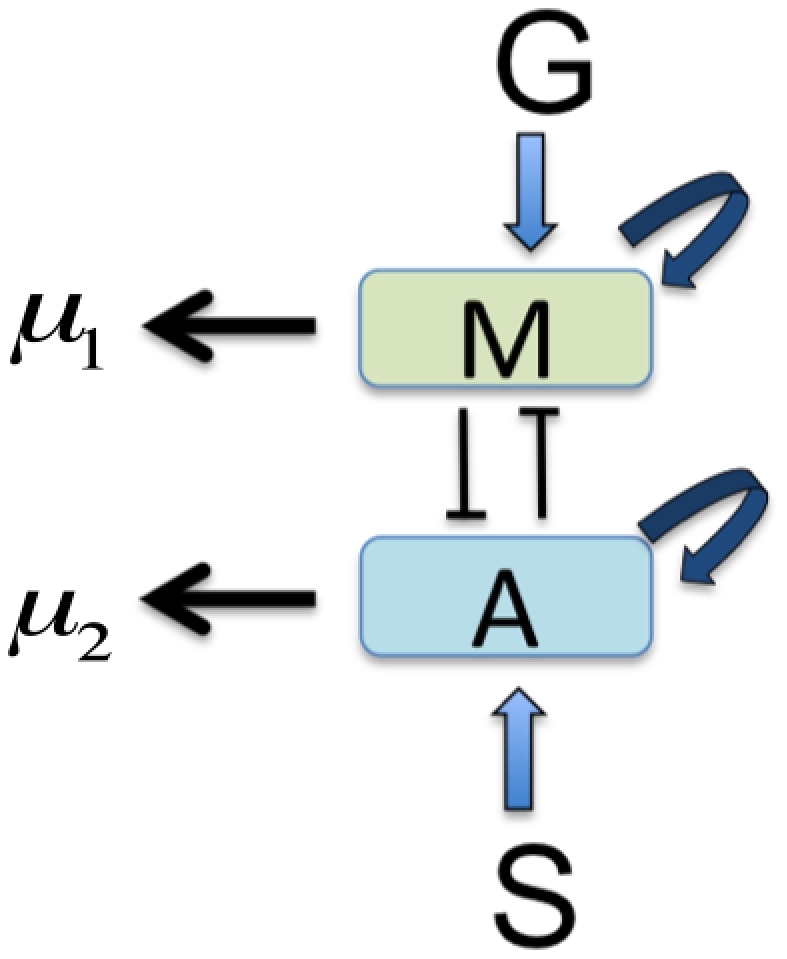
Two key molecules, miR-451 and AMPK complex, are represented by  and
and  respectively. The dynamics of miR451 includes input from glucose (
 ), decay (
 ), and autocatalytic increase. AMPK complex is induced by source (
 ), and undergoes autocatalytic increase with natural decay (
 ). In addition, there are mutual inhibition mechanisms between
  and
and  .
.