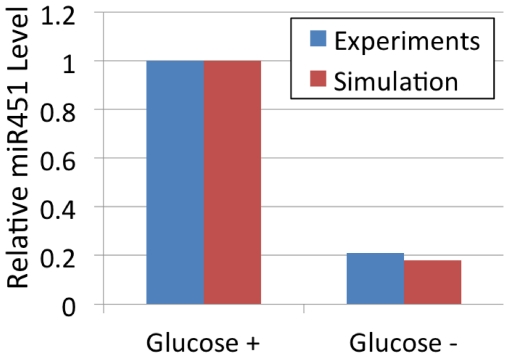
Figure 5. Experiments vs. simulation.
Effect of glucose deprivation on miR-451 expression levels. In [2], miR-451 level was reduced by 21% for different cell lines (U251, LN229) after cells are cultured for 24 hr in normal (+, glucose  or reduced glucose (−, glucose 0.3 g/l). Simulation results (red) are in good agreement with experimental results (blue; U251 cell line) from [2]. Y-axis in the figure is the relative miR-451 concentration for high (glucose+; dimensionless value
  in simulation) and low (glucose−, glucose−,
  in simulation) level of glucose in the medium.

