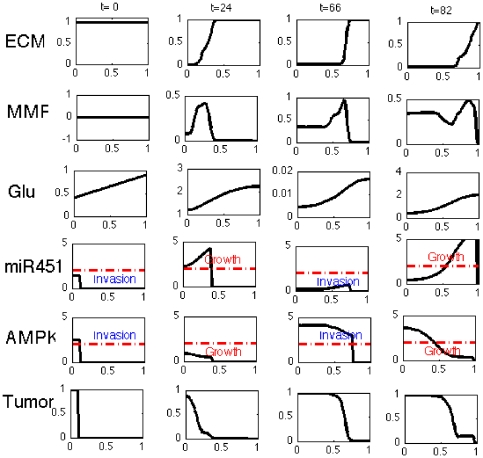
Figure 7. Typical evolution of spatial profiles of tumor density ( ) and concentrations of ECM (
 ), MMPs (
 ), glucose (
 ), miR-451 (
 ), and AMPK (
 ).
).
In each subfigure x-axis indicates the computational domain, left end ( ) being the center of tumor mass and right end (
 ) being the farthest field away from the tumor. Glucose was provided on the right hand side of the domain near
  and glucose is transported by diffusion. Injection of glucose (
 ) was given on the right side of domain (
 ) at time
  . Levels of miR-451 and AMPK change in response to fluctuating glucose and determine whether cells would invade or grow. The red dotted line (−.) indicates the threshold
  .
.

