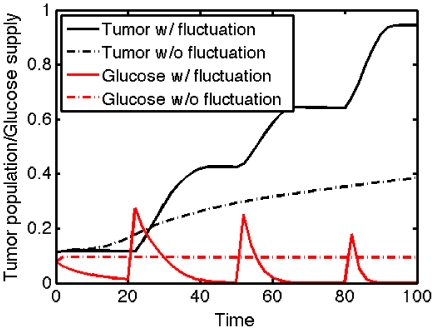
Figure 9. Comparison of tumor growth.
Time evolution of total tumor population and total glucose level near far away field. In responds to periodic input of high glucose, tumor population shows alternating growth and invasion pattern (solid;black). When same amount of glucose without glucose fluctuation was provided to the system near  , tumor population growth is induced from diffused glucose level and followed high miR-451 and low AMPK concentration at cell site. This induces a low chance of cell invsion near the surface and eventually total growth is low compared to the case with fluctuating glucose level.

