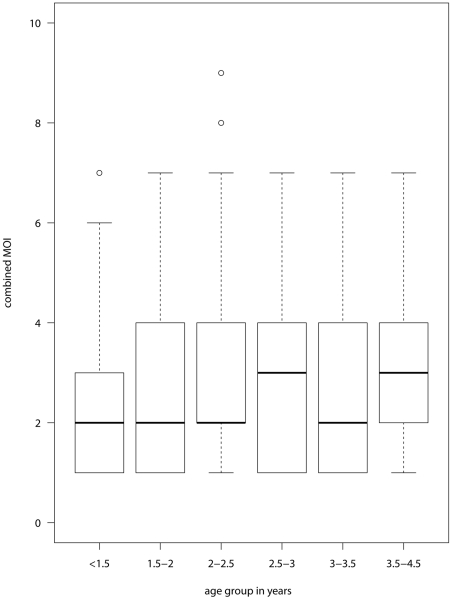
Figure 3. Boxplot of MOI by age group.
The median is represented by the central line. The box represents the interquartile range from the 25th to 75th centiles. The whiskers extend to the most extreme data point which is no more than 1.5 times the interquartile range from the box, points beyond this are plotted individually.

