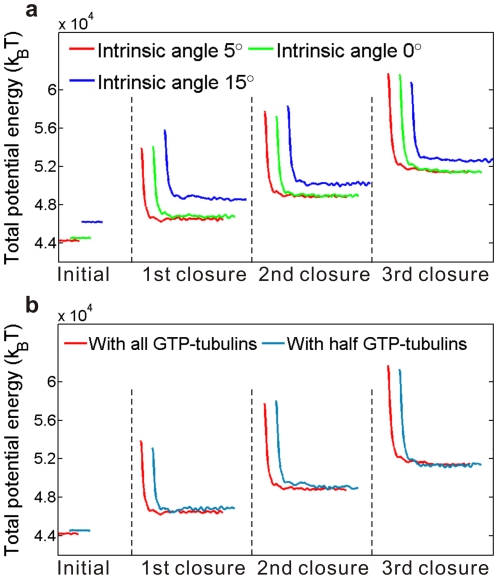
Figure 5. Comparison of the energy barriers and energy differences during sheet-to-tube transitions under different sheet structures: (a) the intrinsic curvatures of GTP-tubulins are of three different values, and (b) the sheets are in two different nucleotide states.
In both panels, the red lines represent the result for the standard model shown in Fig. 4. For clarity, the three sets of data have been offset horizontally, but not vertically.

