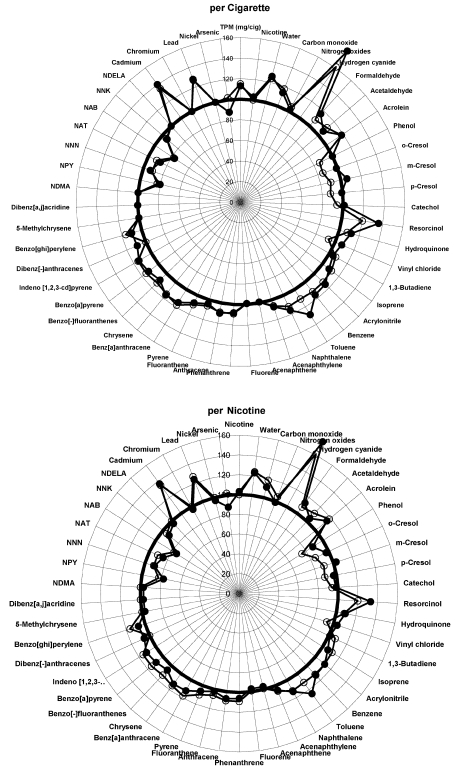
Figure 2. Graphical display of smoke constituents per cigarette and per unit of nicotine compared to control cigarettes for ingredient group 1.
Low levels of additives are open circles, high levels are solid circles. Points outside the circle at 100% indicate increased levels of smoke constituents; points inside indicate less.

