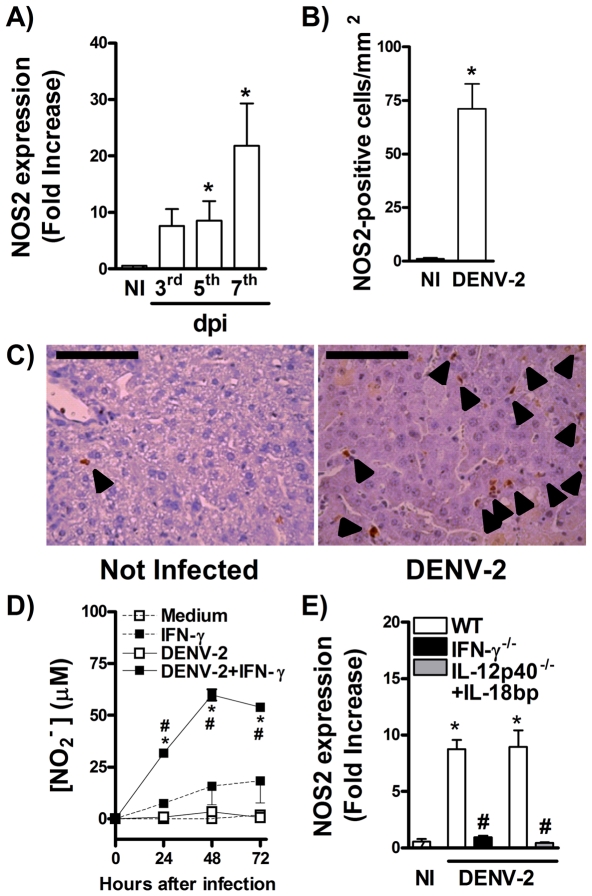
Figure 5. IFN-γ controls NOS2-mediated NO production during DENV infection.
(A–C) WT mice were inoculated with 10LD50 of DENV-2 and at the indicated timepoints, the following parameters were assessed: NOS2 RNA expression in spleen, determined by qPCR (A); NOS2 staining in liver, assessed by IHC at the 7th day of infection (B, C). (D) Bone marrow derived dendritic cells were infected with DENV-2 (MOI 0,1 PFU/cell) in the presence or not of IFN-γ, and at the indicated timepoints, NO production was quantified by Griess reaction. (E). WT, IFN-γ−/− and hIL-18 bp-treated IL-12p40−/− mice (daily i.p. injection of 250 µg of protein, n = 5 mice per group) were inoculated with 10LD50 of DENV-2 (i.p) and in the fifth day of infection NOS2 RNA expression was determined by qPCR. Results are shown as fold increase over basal expression in control mice (A, E); number of positive cells per mm2 of liver (B); and µM of nitrite in medium (D). Results are expressed as mean ± SEM and are representative of at least two independent experiments. N = 5 mice per group. * P<0.05 vs. NI. # P<0.05 vs. WT. In (E), * P<0.05 vs. DENV-2 infected cell, and # for P<0.05 vs. medium or IFN-γ-treated cells. dpi:day post-infection.

