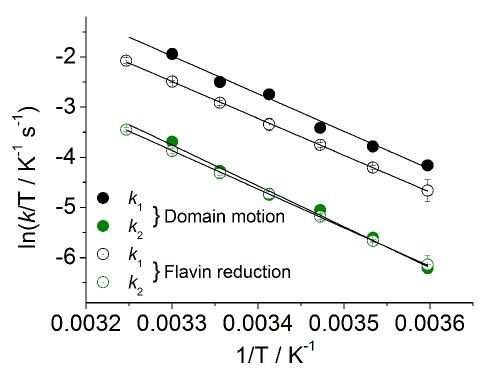
Figure 4. The temperature dependence of the observed rate of flavin reduction and domain motion in CPR are the same.
Temperature dependence data for conformational change (filled circles) and flavin reduction (open circles) are extracted from stopped-flow fluorescence and absorbance measurements, respectively. Data are shown for both 2-electron (black, k 1) and 4-electron (green, k 2) reduction. Black lines show the fit to the Eyring equation and extracted parameters are reported in Table 1. Conditions: 50 mM potassium phosphate pH 7. Labelled CPR and unlabelled CPR concentrations were ∼0.5 and 40 µM, respectively.

