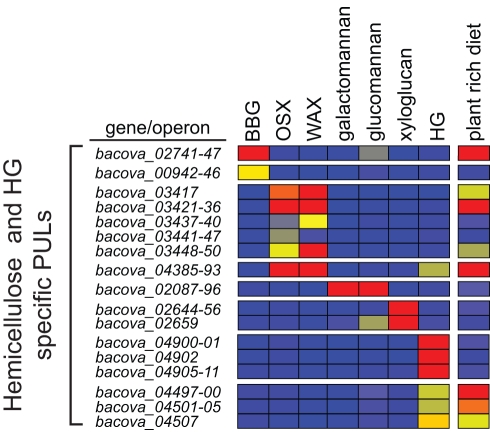
Figure 2. B. ovatus PULs expressed in response to plant cell wall glycans.
A heatmap showing PUL operon induction by various hemicelluloses and homogalacturonan. Data analysis is identical to that described for B. thetaiotaomicron in Figure 1, including comparison to a MM-G reference and use of a ≥10-fold cutoff. The rightmost column in the heatmap shows the responses of PULs in the ceca of mice fed the same plant-rich diet used for B. thetaiotoamicron. Heatmap values are calibrated according to the bar shown in Figure 1. A Venn diagram illustration of total gene changes in these conditions is provided in Figure S6. BBG, barley β-glucan; OSX, oat spelt xylan; WAX, wheat arabinoxylan; HG, homogalacturonan.

