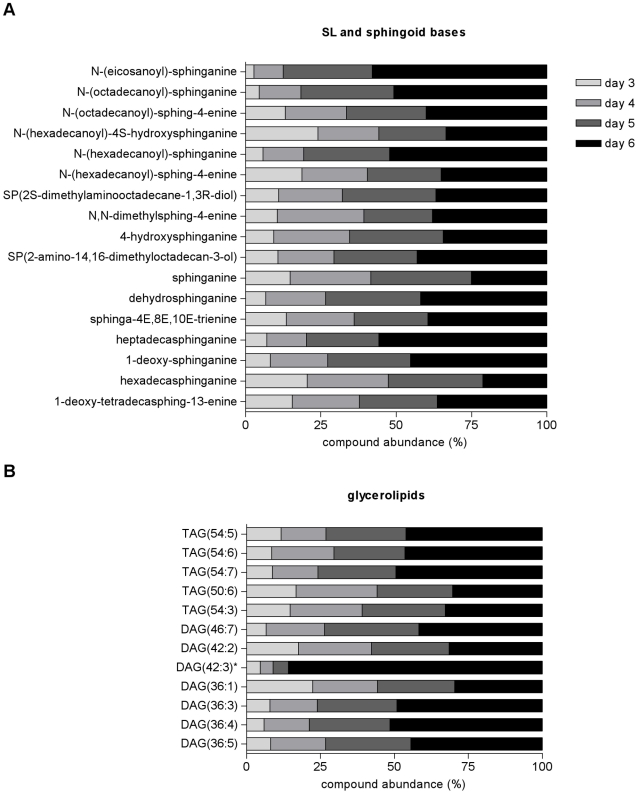
Figure 7. Stage specific increase of sphingolipids and glycerolipids abundance during L. donovani promastigotes development in vitro.
(A) Sphingolipids and sphingoid base and (B) glycerolipid metabolites abundance is represented for each day as a percentage of the total abundance detected, which comprises the sum of the total metabolite intensity on each of the 4 days analysed. Metabolites labelled with * represent peaks with multiple potential identifications, for which just one is shown in this figure but the full list is given in the Supporting Information. DAG, diacylglycerol; TAG, triacylglycerol.

