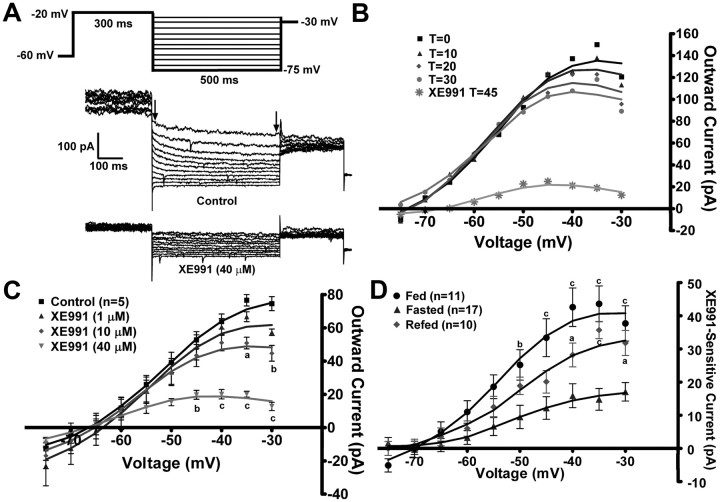
Figure 2.
Fasting reduces the activity of the M-current in NPY neurons. A, The slow deactivation of the M-current (IM) in NPY neurons was recorded from fed, male mice using whole-cell patch-clamp recording. From a holding potential of −60 mV, a voltage jump to −20 mV (300 ms) was followed by steps from −25 to −75 mV in 5 mV increments (500 ms). Currents were recorded under control conditions and after 10 min incubation with XE991 (40 μm), a selective KCNQ blocker in the presence of TTX (1 μm). The XE991-sensitive current was calculated by subtracting the current relaxation [the difference between the instantaneous and steady state (arrows)] in XE991-treated traces from the control traces. This XE991-sensitive current is graphed as an I–V plot (D) (Xu et al., 2008). B, The K+ currents evoked by the deactivation protocol do not run down over the 30 min recording period. T = 0 is 3 min after whole-cell access. XE991 (40 μm) was perfused after 30 min to demonstrate the amount of M-current still active. The figure is from one cell, but rundown was examined in two other cells with the same results. C, To determine the most effective dose to measure the M-current across treatments, a sequential concentration response of XE991 (1, 10, 40 μm) was applied to same neuron (n = 5). I–V plots were analyzed by a two-way ANOVA (p < 0.05, F = 4.67, df = 3) followed by Bonferroni–Dunn comparison. ap < 0.05; bp < 0.01; cp < 0.001 compared with control. D, In NPY neurons, the I–V plot of A from fed males (n = 11), fasted males (n = 17), and 24 h refed males (n = 10). I–V plots were analyzed by a two-way ANOVA (p < 0.01, F = 7.3, df = 2) followed by Bonferroni–Dunn comparison. ap < 0.05; cp < 0.001, compared with fasted. Error bars indicate SEM.

