Figure 7.
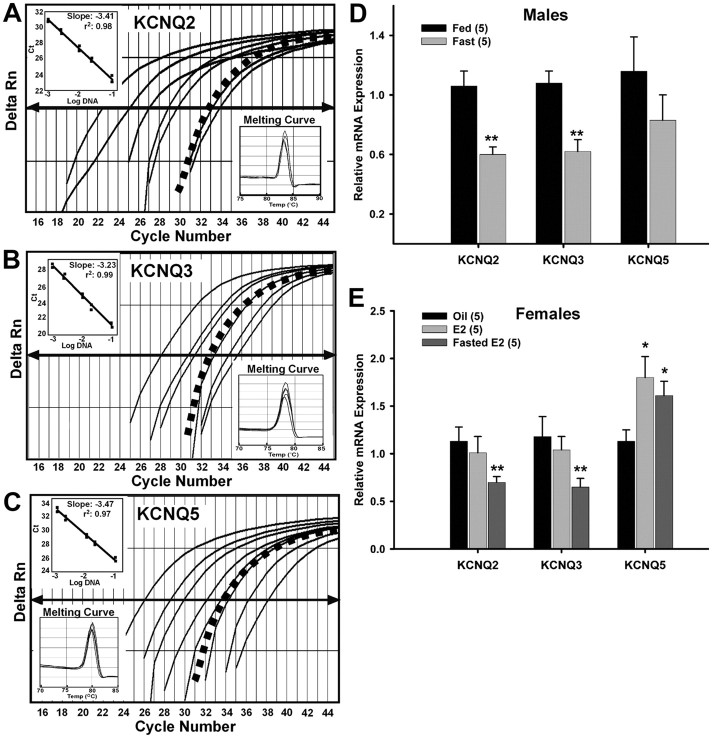
Fasting reduces KCNQ2 and KCNQ3 expression and 17β-estradiol increases KCNQ5 expression in NPY neurons. A–C, Quantitative real-time PCR assays for KCNQ2 (A), KCNQ3 (B), and KCNQ5 (C) transcripts using the SYBR Green method. Standard curves were prepared with basal hypothalamic cDNA serial dilutions as follows: 1:50, 1:100, 1:500, 1:1000, 1:5000, 1:7500, and 1:10,000. Cycle number was plotted against the normalized fluorescence intensity (Delta Rn) to visualize the PCR amplification. The cycle threshold (CT, arrow) is the point in the amplification at which the sample values were calculated. The BH cDNA serial dilutions and one representative NPY pool (black squares) are illustrated in A–C. The insets in A–C show standard curve regression lines, slopes from serial dilution data, and the dissociation (melting) curves for all three transcripts. The amplification efficiencies calculated from the slopes were 96% for KCNQ2, 100% for KCNQ3, and 94% for KCNQ5. These efficiencies allowed us to use the ΔΔCT method for quantification. The melting curves depict single-product melting at 83, 78, and 80°C for KCNQ2, -3, and -5, respectively. Single peaks illustrate that only one product was formed in NPY pools. β-Actin was used as control and its primer pair was 100% efficient (data not shown). Negative (CSF, -RT cell, and tissue samples) and positive tissue controls were analyzed on each plate along with the experimental samples. D, Using cell harvesting coupled with quantitative real-time PCR, fasting significantly reduced the expression of KCNQ2 and KCNQ3 in NPY neurons [3–4 pools of 5 (KCNQ2/3) or 10 (KCNQ5) cells each from 5 animals; n = 5] from male mice. **p < 0.01. E, E2 treatment significantly increased the expression of KCNQ5 while fasting significantly reduced the expression of KCNQ2 and KCNQ3 in NPY neurons [3–4 pools of 5 (KCNQ2/3) or 10 (KCNQ5) cells each from 5 animals; n = 5] from female mice. *p < 0.05; **p < 0.01, compared with oil-treated. KCNQ2 and KCNQ3 expression in fed, E2-treated, and fasted, E2-treated were significantly different (p < 0.05). Error bars indicate SEM.

