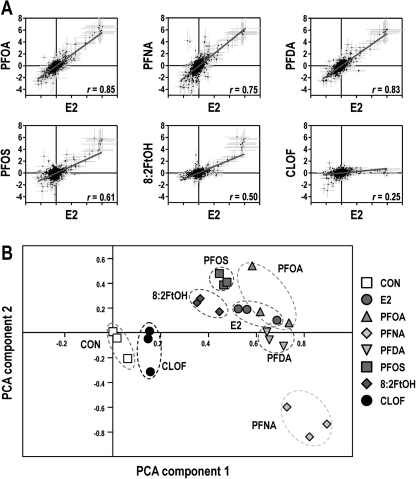
FIG. 3.
Dietary exposure to PFAAs induces an estrogen-like hepatic gene expression profile in trout. (A) Pairwise correlation of hepatic gene expression profiles. Values shown are the log2 geometric mean of fold change for each array feature ± SE (n = 3). Pearson correlation coefficients (r) are indicated for each comparison, and overlay lines indicate results of least-squares linear regression analysis. A color version of this figure is available in the online version of this article. (B) PCA on experimental condition. PC1 and PC2 are shown and account for 57.9 and 9.6% of experiment variance, respectively. Symbols represent biological replicates (n = 3), and dashed circles represent overlap, or lack thereof, among treatment groups. A color version of this figure is available in the online version of the article.

