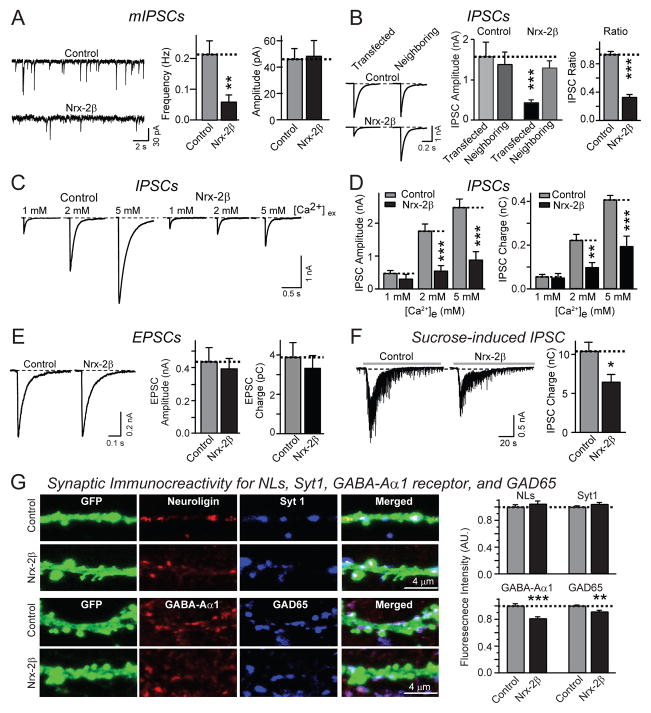
Figure 2. Postsynaptic expression of neurexin-2β impairs inhibitory synaptic strength.
All data are from cultured hippocampal neurons co-transfected with an EGFP expression plasmid and either an empty vector (control), or a vector encoding neurexin-2β (Nrx-2β). A. Representative traces (left), and summary graphs of the mean frequency (center) and amplitudes (right) of mIPSCs recorded in 1 μM TTX and 10 μM CNQX (control: n=26/3; Nrx-2β: n=24/3).
B. Representative traces (left), mean amplitudes (center), and IPSC ration (right) of IPSCs recorded from neighboring transfected and non-transfected neurons (control: n=11 pairs/3 cultures; Nrx-2β: n=12 pairs/3 cultures).
C. and D. Representative traces (C) and summary graphs of the amplitudes (D left) and synaptic charge transfer (D right) of IPSCs recorded in 1, 2 and 5 mM extracellular Ca2+ (control: n=17/3, 17/3 and 20/3 at 1, 2 and 5 mM extracellular Ca2+; Nrx-2β: n=17/3, 18/3 and 23/3 at 1, 2 and 5 mM Ca2+).
E. Representative traces (left), mean amplitudes (center), and mean charge transfer (right) of EPSCs recorded from control or neurexin-2β transfected neurons in the presence of 10 μM picrotoxin (control: n=28/4; Nrx-2β: n=32/4).
F. Representative traces (left) and mean charge transfer (right; integrated over 60 s) of IPSCs elicited by hypertonic sucrose (0.5 M for 30 s; control: n=36/8; Nrx-2β: n=42/8).
G. Measurement of synaptic signals for neuroligins and GABA-Aα1 receptors in neurons expressing neurexin-2β. Transfected neurons were stained with a pan-neuroligin antibody (Song et al., 1998) and synaptotagmin-1 (Syt1), or for GABA-Aα1 receptors and GAD65. Panels show representative images (left) and quantitations of the staining intensity per synapse for all four markers (right).
For all representative data, scale bars apply to all panels in a set. All summary graphs show means ± SEMs; statistical comparisons by Student’s t-test yielded: n.s.=non-significant, *=p<0.05; **=p<0.01, ***=p<0.001. For additional data, see Fig. S2.

