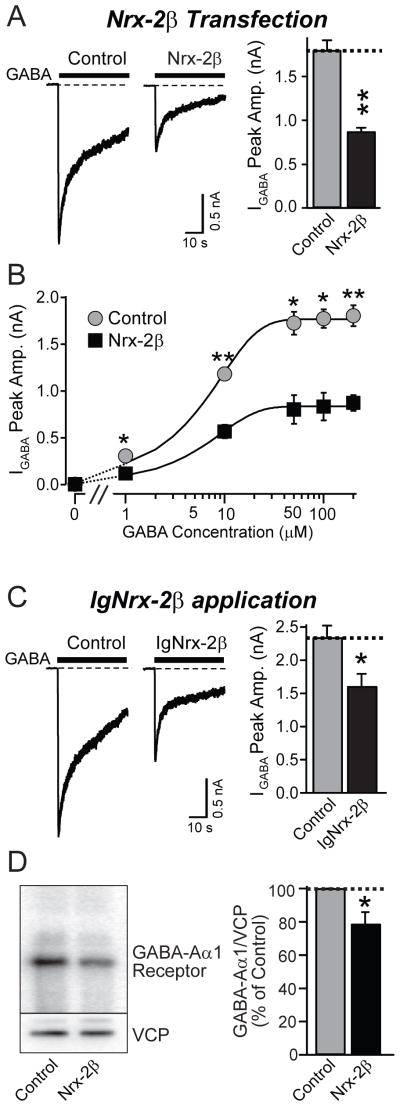
Figure 8. Neurexin-2β impairs GABAAα1-receptor function in transfected HEK293 cells.
A. Representative traces (left) and peak amplitudes (right) of currents induced by application of 0.2 mM GABA to HEK293 cells stably expressing GABAA-receptors (α1β2γ2, CRL-2029 from ATCC), and transfected with pCMV5 (control) or vector expressing neurexin-2β (control: n=18/3; Nrx-2β: n=18/3).
B. Plot of the current amplitude induced as described in A. as a function of the GABA concentration (control: n=19/4; Nrx-2β: n=17/4). For a scaled plot to document a lack of change in apparent GABA-affinity, see Suppl. Fig. 12.
C. Representative traces (left) and peak amplitudes (right) of currents induced by application of 0.2 mM GABA to HEK293 cells stably expressing GABAA receptors that had been incubated for 48 h with 1 μM control IgC or IgNrx-2β (control: n=15/3; IgNrx-2β: n=16/3).
D. Quantitation of the levels of GABAAα1-receptor in HEK293 cells that stably express GABAA-receptors, and were transfected with either an empty vector (control), or a vector encoding neurexin-2β (Nrx-2β) (n= 13 independent cultures).
For all representative traces, scale bars apply to all traces in a set. All summary graphs show means ± SEMs; statistical comparisons by Student’s t-test yielded *=p<0.05; **=p<0.01, ***=p<0.001. For additional data, see Fig. S8.

