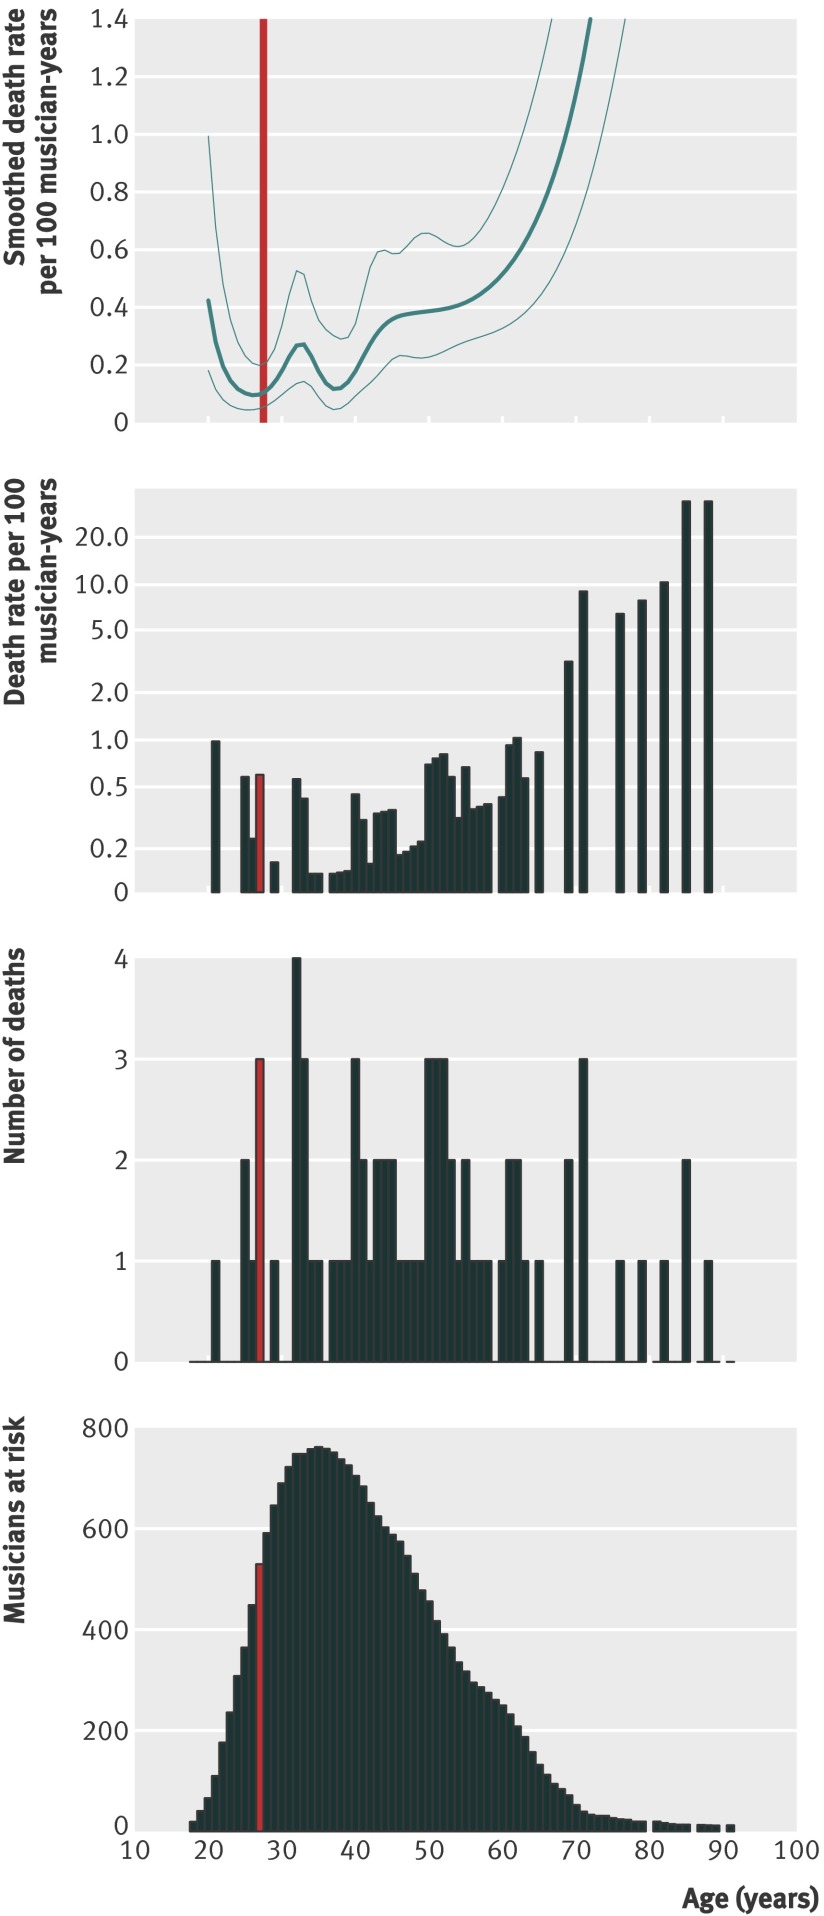
Fig 2 Smoothed mean death rate per 100 musician years using a spline with a 95% confidence interval (top), mean death rate per 100 musician-years (second from top) number of deaths (third from top), and number of musicians at risk (bottom) by age in years. Age 27 is marked in red. Y axis for smoothed death rates restricted to 0 to 1.4 to focus on the ages of interest. Y axis for mean death rates is on log scale to focus on younger ages

An official website of the United States government
Here's how you know
Official websites use .gov
A
.gov website belongs to an official
government organization in the United States.
Secure .gov websites use HTTPS
A lock (
) or https:// means you've safely
connected to the .gov website. Share sensitive
information only on official, secure websites.
