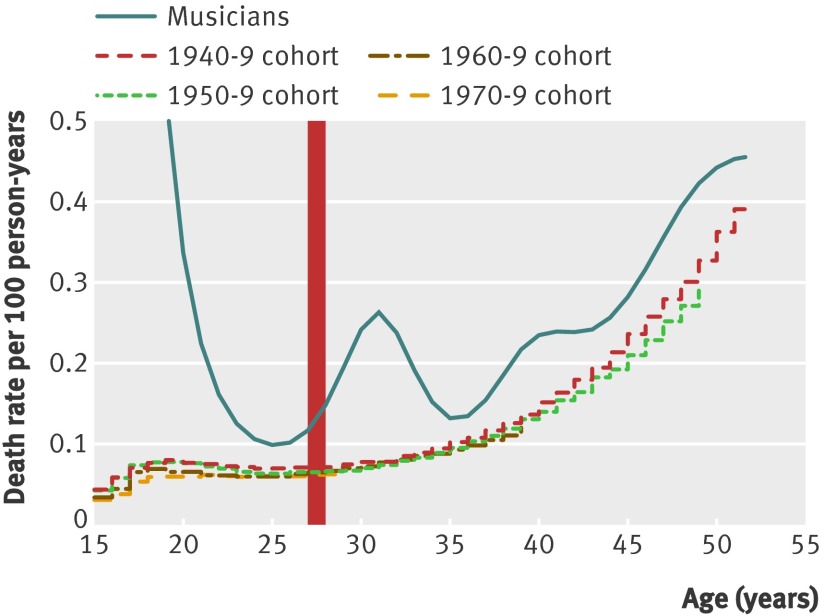
Fig 3 Deaths rates in the general UK population per 100 person years by age and decade of birth (cohort) for ages 18 to 50, and smoothed death rate per 100 musician years. Vertical red line indicates age 27, with no increase in risk. Each cohort’s line ends at the age where no more data are available

An official website of the United States government
Here's how you know
Official websites use .gov
A
.gov website belongs to an official
government organization in the United States.
Secure .gov websites use HTTPS
A lock (
) or https:// means you've safely
connected to the .gov website. Share sensitive
information only on official, secure websites.
