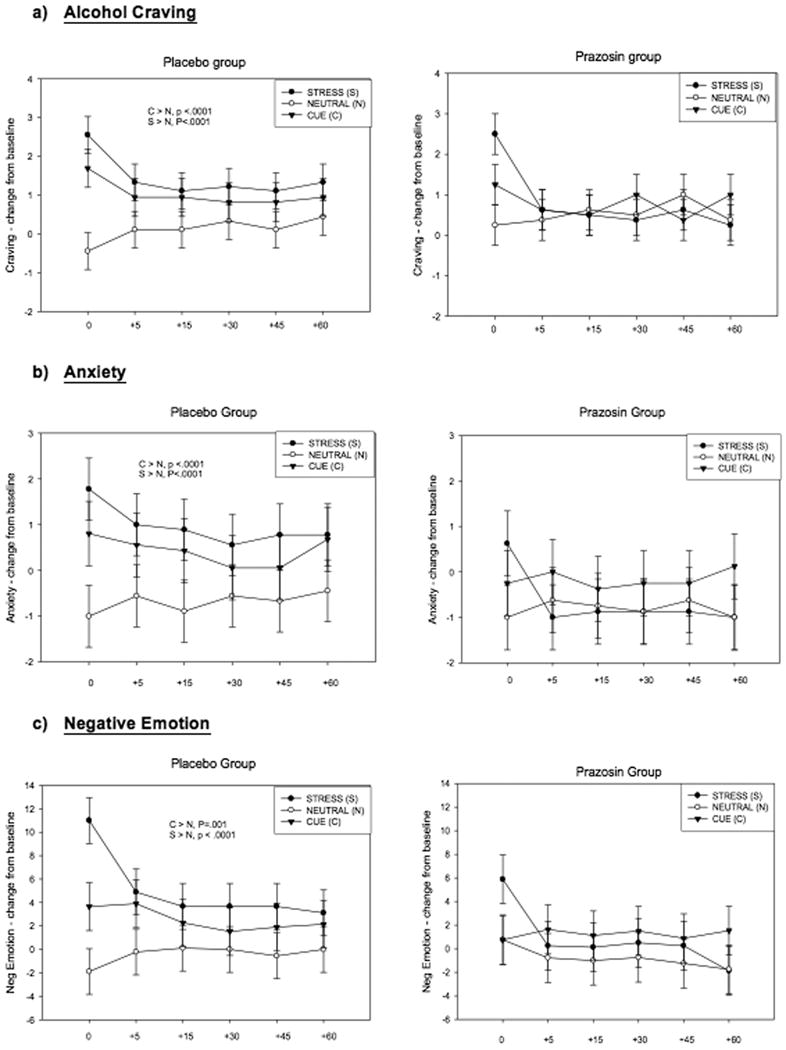
Figure 1. Line graphs showing subjective response to stress, alcohol cue and neutral imagery.
- PZ < PL following exposure to stress imagery (p<.04)
- PZ < PL following exposure to stress imagery (p<.0001)
- PZ < PL following exposure to stress imagery (p=.003)