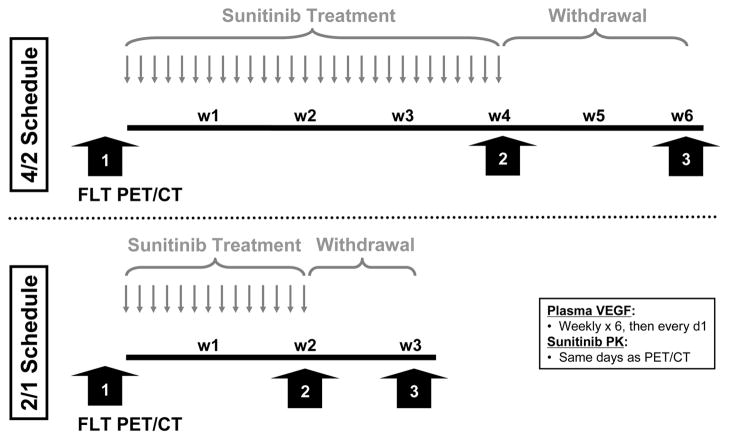
Figure 1.
Schema of pharmacodynamic and pharmacokinetics time points. Patients were administered sunitinib 50 mg daily on the intermittently dosed 4/2 schedule (top) or 2/1 schedule (bottom). FLT PET/CT images were performed at baseline, peak sunitinib exposure, and during sunitinib withdrawal as indicated by the wide arrows. FLT, 18F-Fluorothymidine. PET, positron emission tomography. CT, computed tomography. VEGF, vascular endothelial growth factor. PK, pharmacokinetics. w, week.

