FIGURE 1.

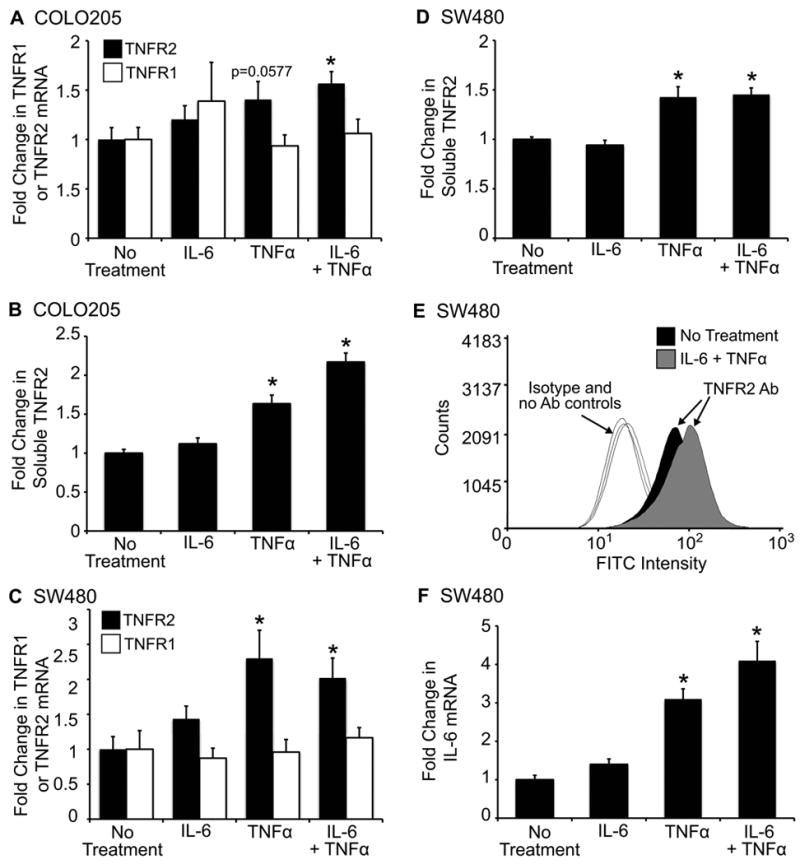
Increased TNFR2 mRNA and protein levels in colon cancer cell lines treated with IL-6 and TNFα. Histograms A –D show levels of TNFR2 mRNA or soluble TNFR2 in SW480 and COLO205 cells treated with 50ng/mL IL-6 plus 50ng/mL TNFα for 10 hours. TNFR2 mRNA was normalized to HMBS. sTNFR2 was measured by ELISA on cell supernatants and values were normalized to total protein. All values are expressed as fold change (mean ±SE) versus mean levels in untreated controls. (* = p ≤ 0.05 compared to no treatment controls). TNFR2 mRNA was significantly increased by IL-6 and TNFα treatment in both cell lines (A and C). Consistent with findings for TNFR2 mRNA, protein levels of soluble TNFR2 were significantly increased with IL-6 and TNFα treatment (B and D). (E) Representative histogram of surface TNFR2 expression as measured by flow cytometry. Cells treated with IL-6 and TNFα exhibit an increase in surface TNFR2 expression. Negative controls include isotype and no antibody controls for each condition. (F) Histograms show IL-6 mRNA levels in SW480 cells. Note that TNFα alone or TNFα + IL-6 elicit similar, significant increases IL-6 mRNA (*p ≤ 0.05 compared to no treatment). For all experiments n ≥ 3 independent experiments performed in duplicate.
