
Figure 5.
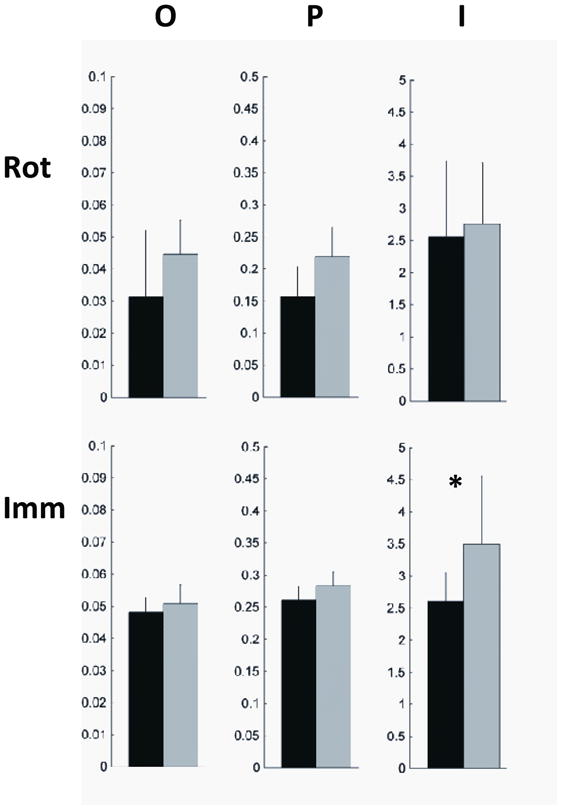
Comparison of cortical slow wave parameters between experimental and control nights for rotation learning (top row) and arm immobilization (bottom row) experiments. For each experiment, we measured the parameters for the ROIs identified in Figures 2 and 3 respectively. O = slow wave origins, P = slow wave propagation density, I = slow wave involvement (see Methods and [33]). Black bars are the experimental nights and gray bars are the control nights. * p<0.05, paired t-test.