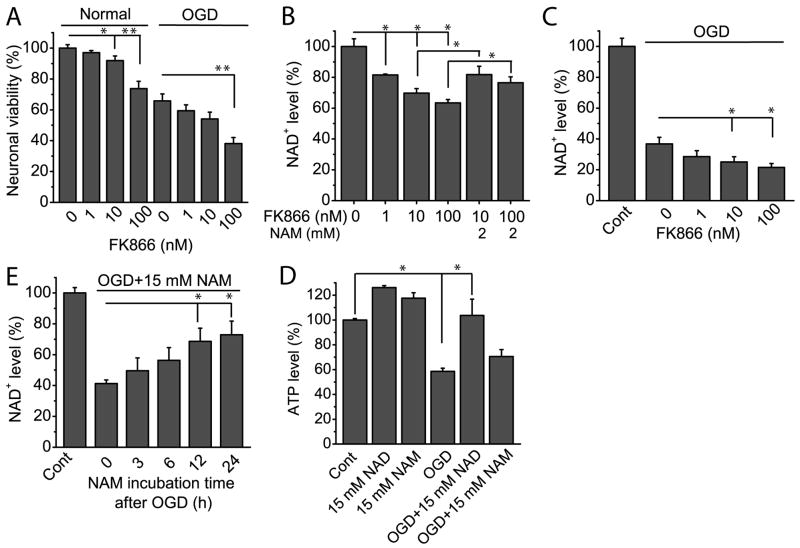
Fig 3. Effect of the inhibition of PBEF by FK866 on cell viability and NAD+ and ATP levels of cultured neurons.
(A) FK866 reduced neuronal viability under normal and OGD conditions. For measurement of cell viability under normal condition, neurons were treated with indicated concentration of FK866 for 4 h, and cell viability was measured with MTT assay at 24 h starting from FK866 treatment. For measurement of cell viability after OGD, neurons were subject to OGD for 1.5 h in the presence of FK866. FK866 is present for a total of 4 h starting from OGD, and cell viability was measured with MTT assay at 24 h starting from OGD. Data were collected from 4 independent experiments. (B) Effect of FK866 and NAM on NAD+ levels in cortical neurons. Neurons were exposed to different concentrations of FK866 alone or together with 2 mM NAM for 4 h, and NAD+ levels were measured. Data were collected from 4 independent experiments. (C) Effect of FK866 on NAD+ levels after OGD. Neurons were subjected to 1.5 h OGD in the absence or presence of FK866. FK866 was present for a total of 4 h after OGD. NAD+ was measured 6 h after OGD or wash-away of FK866. Data were the mean values from 4 independent experiments. (D) The effect of incubation time of 15 mM NAM on NAD+ levels in OGD. Neurons were subjected to 1.5 h OGD in the presence of 15 mM NAM, and NAM was continuously present for different periods of time indicated in the figure. NAD+ levels were measured 6 h later following wash-away of NAM. Data were the mean value from 5 independent experiments. (E) Effect of NAD+ and NAM on ATP levels in normal and OGD conditions. Neurons were treated with 15 mM NAD+ or 15 mM NAM and were or were not subject to OGD for 1.5 h at the same time. NAD+ and NAM was continuously present for a total time of 24 h and ATP was measured 6 h later after wash-away of NAD+ and NAM. Data were the mean values from 4 independent experiments. *t-test with p<0.05; **t-test with p<0.005 vs the indicated conditions.

