
Figure 8. ERK1/2 activation is required for cytokine-induced TH protein turnover.
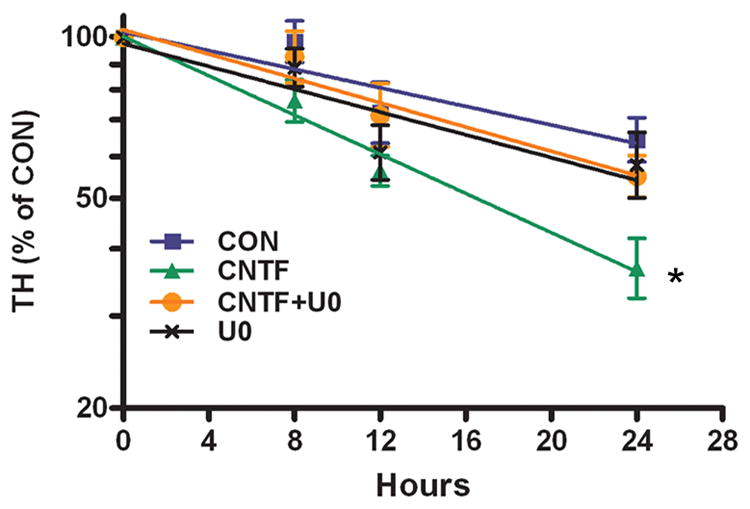
The natural log plot of TH content in M17 cells, graphed as percentage of the TH present at time 0, is shown. Data are the mean of 3 independent experiments ± SEM; * p<0.05 vs. control. Each condition was assayed in triplicate for each experiment. Calculated half-life: Control 33.3±3.6 hr, CNTF 16.3±0.5* hr, CNTF+UO 27.0±3.5 hr, UO 28.3±2.4 hr, n=3 experiments.