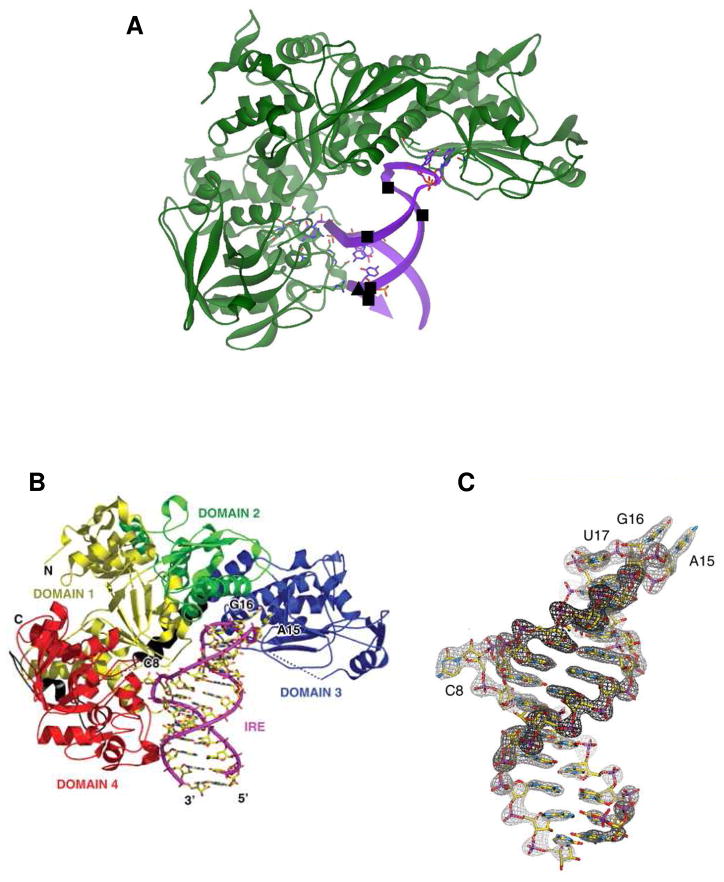
Figure 1. IRP1 binding to FRT IRE-RNA.
The RNA helix bends and contact bases C8 and triloop bases A15 and G16 are flipped out. Panel A: ■, hydrated Mg2+, determined by solution NMR; ▲, Cu1+-1.10-phenanthroline, determined by RNA cleavage in O2. The figure prepared from Protein Data Bank file 2IPY. (From ref. 12, with permission.) Panel B: IRE:IRP complex showing IRP domains (1 yellow; 2 green; 3 blue; 4 red) and contacts with IRE-RNA. Panel C: Electron density of IRE in IRE:IRP complex. (From Ref. 12, see for details).

