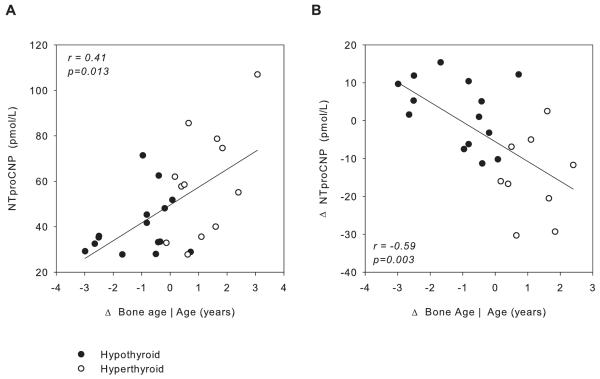
Figure 3.
A. Relation between plasma NTproCNP at baseline and deviation in bone age from chronological age (Δ bone age) in hypo- (filled symbols) and hyperthyroid subjects (open symbols). B. Relation between change from baseline in plasma NTproCNP at 1 mo of treatment (Δ) and deviation in bone age from chronological age in hypo- (filled symbols) and hyperthyroid subjects (open symbols). Regression lines were derived by the method of least squares.

