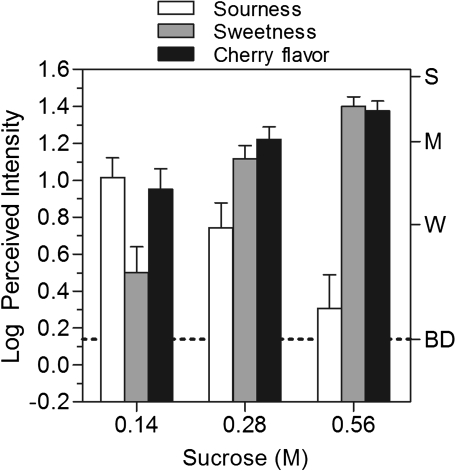
Figure 5.
Log mean ratings of the perceived intensity of sourness (empty bars), sweetness (light bars), and cherry flavor (black bars) of a flavored beverage with 3 different concentrations of sucrose added. Sweetness and cherry flavor increased monotonically with sucrose concentration, whereas sourness declined. Letters on the right y axis represent labels on the gLMS: BD, barely detectable; W, weak; M, moderate; S, strong. Vertical bars represent the standard errors of the mean.

