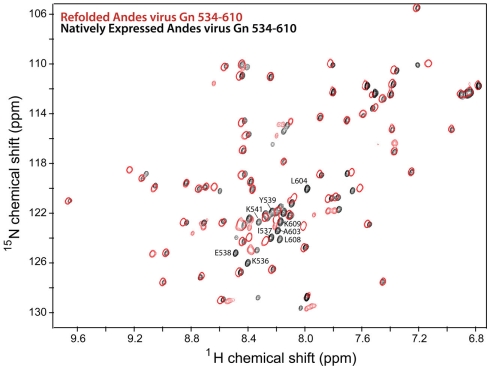
Figure 3.
Overlay of 2D 1H–15N HSQC spectra of the Andes virus Gn (534–610) that has been refolded from insoluble inclusion bodies (red) and that was natively expressed in the soluble fraction (black). Notably, the chemical shift values for the flanking sequences are different for each spectra, indication two conformations for these sequences.

