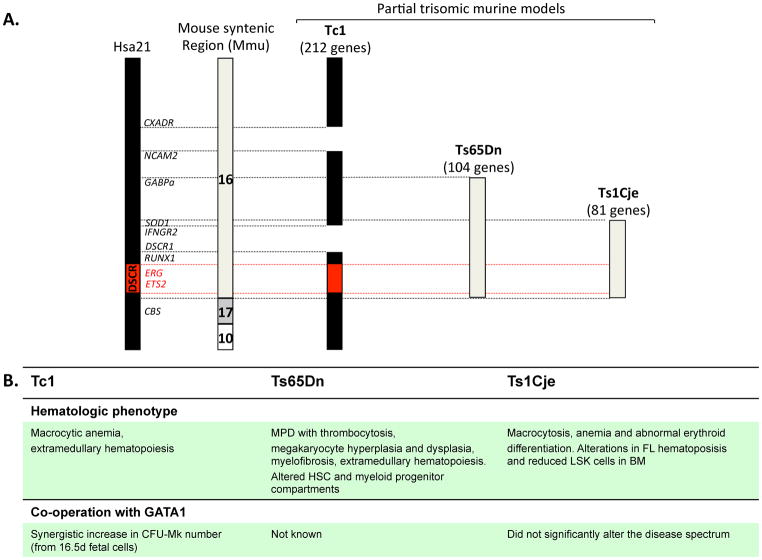
Figure 1. Diagram of Hsa21 and the regions of trisomy in the various mouse models of DS.
A) Human chromosome 21 and specific genes in the DS critical region (DSCR) that may contribute to the development of leukemia are shown. The syntenic murine Mmu16 with varying degrees of trisomic representation in the different mouse models is depicted on the right. B) Summary of the hematopoietic phenotype of the murine models and the effect of coexpression of GATA-1s.

