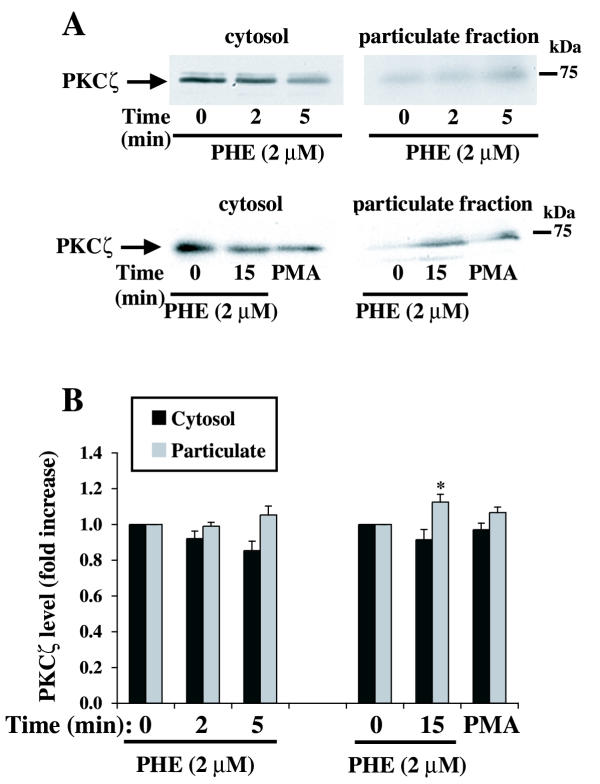
Figure 3.
Effect of PHE and PMA on PKCζ localization in rat-1 fibroblasts. Serum-deprived cells in DMEM were treated with 2 μM PHE or 1 μM PMA for 2, 5, 10 and 15 min, lysed and cytosol and particulate fractions were subsequently prepared as described in methods. A representative Western blot is shown in A. The bar graph (B) represents quantitation of the PKCζ protein bands by densitometric analysis of blots from five different experiments. * Value significantly different from time = 0 (cytosol or particulate), p < .05.

