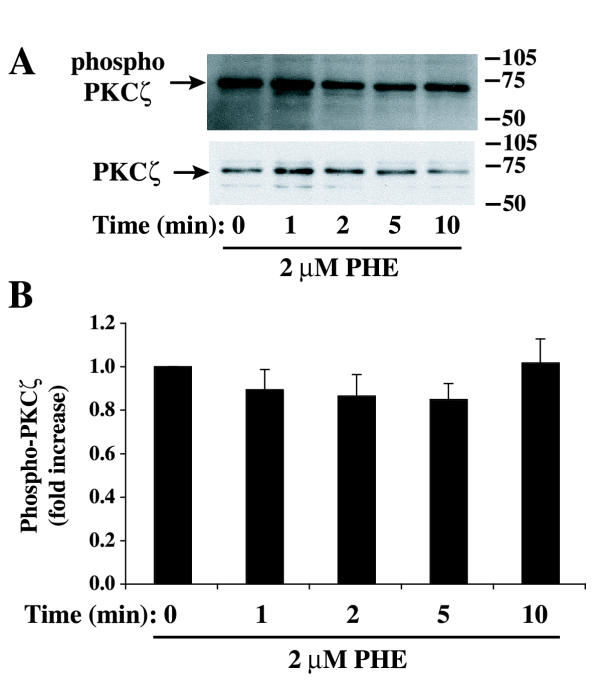
Figure 4.
Effect of PHE on PKCζ phosphorylation at Thr 410. Cells were arrested for 48 hours and incubated for different time with 2 μM PHE. Samples were prepared for Western blot analysis and incubated with a phospho-PKCζ/ (Thr 410/403) antibody (A, top) as described in Methods. The same membranes were stripped off and reprobed with PKCζ antibody (A, bottom). The bar graph (B) represents quantitation of the ratio phospho-PKCζ/ PKCζ protein bands by densitometric analysis of blots from three different experiments. No statistically significant differences were found.

