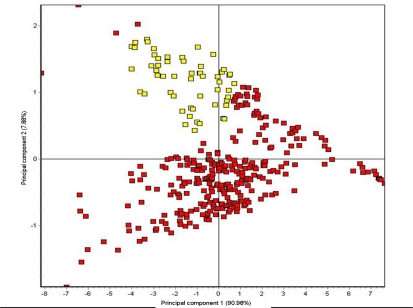
Figure 3.
Aroma map plot showing discrimination of volatiles from healthy control wood blocks (yellow labels) and volatiles from artificially-inoculated decayed wood block (red labels) using principal component analysis (PCA) of mean changes (shifts) in quartz crystal oscillation frequency (Δf) in response to differences in VOC mixture composition in headspace volatiles from different sample types.

