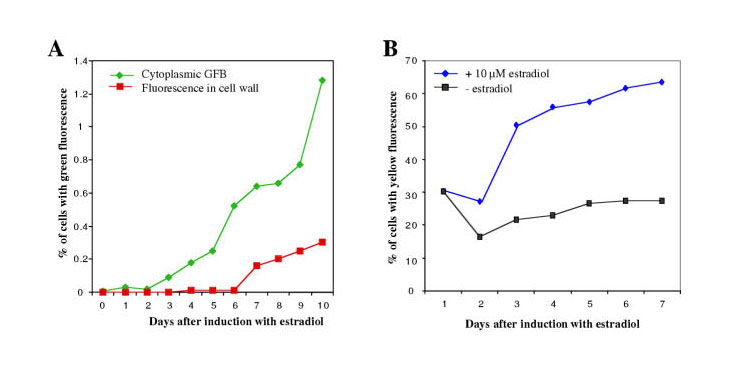
Figure 2.
Accumulation of green and yellow auto-fluorescence in ERE::P1 cells. (A) Accumulation of green fluorescence in ERE:: P1 cells after induction with estradiol. The y-axis indicates the percentage of cells with cytoplasmic GFBs (green line) or cell wall green fluorescence (orange line). (B) Accumulation of yellow auto-fluorescence in ERE::P1 cells treated (blue line) or not treated (black line) with estradiol. The y-axis indicates the percentage of cells displaying yellow fluorescence.

