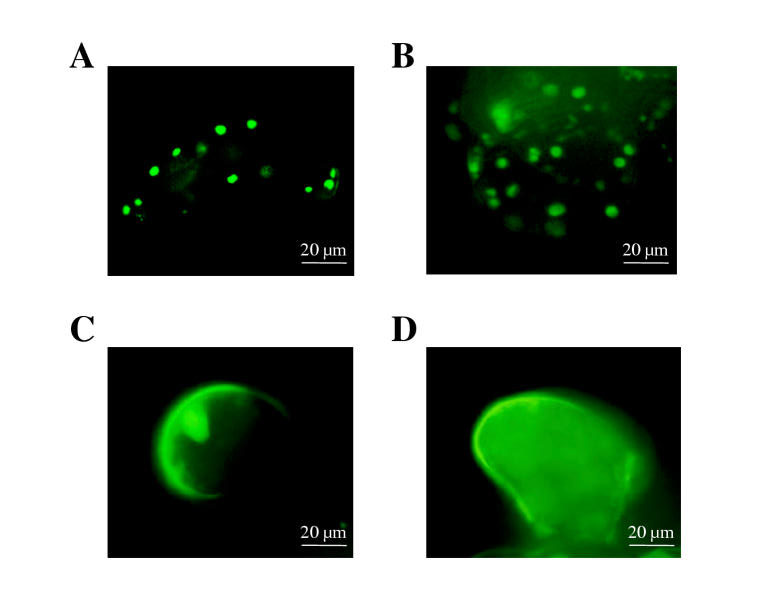
Figure 4.
Localization of GFBs in ERE::P1 induced BMS cells. (A-D) Epifluorescence microscopy of cells present in ERE::P1 cells induced for 7–10 days with 10 μM estradiol representing the accumulation of GFBs in the cytoplasm (A, B), their migration to the cell surface (C) and release of green fluorescence to the cell wall (D).

