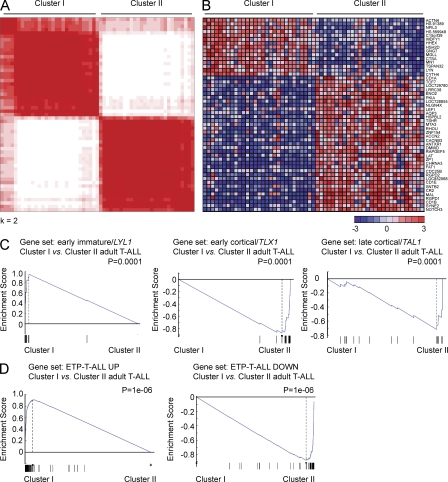
Figure 1.
Gene expression profiling identifies high prevalence of early immature leukemias in adult T-ALL. (A) Consensus clustering of microarray gene expression data of 57 adult T-ALL samples. (B) Top 50 differentially expressed genes between adult T-ALL cluster I and cluster II samples. Genes in the heat map are shown in rows and each individual sample is shown in one column. The scale bar shows color-coded differential expression from the mean in standard deviation units with red indicating higher levels and blue lower levels of expression. (C) GSEA analysis of early immature/LYL1-positive, early cortical/TLX1-positive, and late cortical/TAL1-positive associated genes in the gene expression clusters I and II identified in adult T-ALL. (D) GSEA of genes associated with pediatric ETP-T-ALLs in adult T-ALL gene expression clusters.

