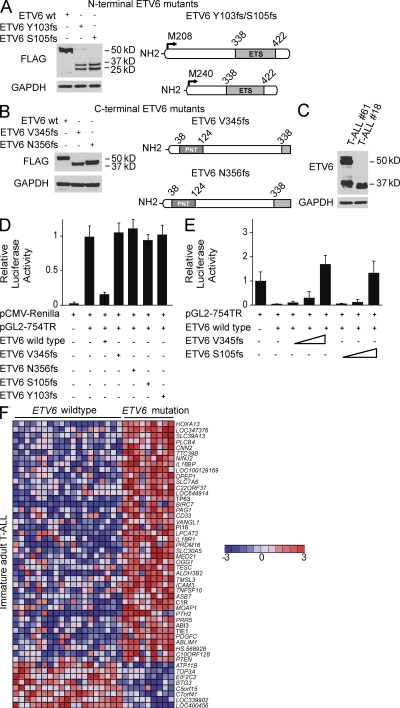
Figure 4.
Functional analysis of truncating ETV6 mutant alleles. (A and B) Western blot analysis of FLAG-tagged N-terminal (Y103fs, S105fs) (A) and C-terminal (V345fs, N356fs) (B) ETV6 mutants expressed in HEK293T cells. The FLAG epitope was introduced in the C terminus of the N-terminal Y103fs and S105fs mutants and in the N terminus of the C-terminal ETV6 V345fs and N356fs mutants. Blots were probed with anti-FLAG or anti-GAPDH as loading control. (C) Lysates from primary adult T-ALL samples harboring a heterozygous C-terminal (V345fs, #61) and a homozygous N-terminal (Y103fs,#18) ETV6 mutation were analyzed by Western blot. Wild-type ETV6 proteins are detected as 50 and 57 kD anti-ETV6 immunoreactive bands and anti-GAPDH as loading control. (D) Effects of ETV6 mutant alleles in the activity an ETV6-responsive reporter plasmid (pGL2-754TR). Luciferase activity is shown relative to empty vector and normalized using an internal control plasmid expressing Renilla luciferase. Experiments were performed in triplicate and repeated at least twice. (E) Luciferase assay analyzing the effects of increasing amounts (indicated by wedges) of C-terminal (V345fs) and N-terminal (S105fs) ETV6 mutants on the activity of wild-type ETV6. Experiments were performed in triplicate and repeated at least twice. (F) Supervised analysis of ETV6 mutant versus ETV6 wild-type gene expression signatures in early immature adult T-ALLs (P < 0.001). Top 50 differentially expressed genes are shown. Genes in the heat map are shown in rows, each individual sample is shown in one column. The scale bar shows color-coded differential expression from the mean in standard deviation units, with red indicating higher levels and blue lower levels of expression.

