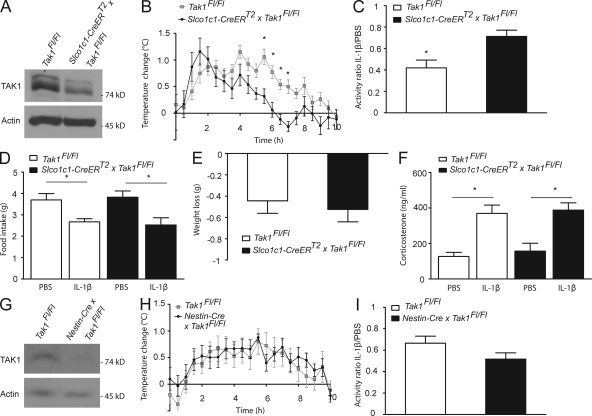
Figure 3.
Slco1c1-CreERT2 x Tak1Fl/Fl mice show a blunted fever response and reduced sickness behavior upon stimulation with IL-1β. (A) Lysates of PBECs from indicated mice were analyzed by Western blotting. One out of three independent experiments is demonstrated. (B) The rise in body temperature in Slco1c1-CreERT2 × Tak1Fl/Fl mice in comparison to control Tak1Fl/Fl mice (n = 7–8 per genotype) upon administration of 30 µg/kg IL-1β i.v. Values are means ± SEM. *, P < 0.05 (repeated measures two-way ANOVA and Bonferroni’s post-test). Pooled data of two independent experiments are shown. (C) IL-1β (30 µg/kg) influence on locomotor activity of Slco1c1-CreERT2 × Tak1Fl/Fl mice and control Tak1Fl/Fl mice (n = 7–8 per group). The ratio of the activity of IL-1β– and PBS-injected animals in the dark phase is shown. Values are means ± SEM. *, P < 0.05 (Student’s t test). (D) IL-1β administration influence on food intake over 22 h in Slco1c1-CreERT2 × Tak1Fl/Fl mice and Tak1Fl/Fl mice. Values are means ± SEM. *, P < 0.05 (one-way ANOVA, Tukey’s post hoc test). (E) Weight loss of Slco1c1-CreERT2 × Tak1Fl/Fl mice and control Tak1Fl/Fl mice over 22 h after i.v. administration of IL-1β. Values are means ± SEM. (F) Plasma corticosterone levels 3 h after IL-1β and PBS administration in Slco1c1-CreERT2 × Tak1Fl/Fl mice and control Tak1Fl/Fl mice. Values are means ± SEM (n = 6–7 animals per group). *, P < 0.05 (one-way ANOVA, Tukey’s post hoc test). Pooled data of two independent experiments are shown. (G) Lysates from the hypothalamus of mice deficient for Tak1 in neurons, oligodendrocytes, and astrocytes (Nestin-Cre × Tak1Fl/Fl mice) and Tak1Fl/Fl mice were analyzed by Western blotting. One out of two independent experiments is shown. (H) The rise in body temperature in Nestin-Cre × Tak1Fl/Fl mice in comparison with Tak1Fl/Fl mice (n = 8 per genotype) upon administration of 30 µg/kg IL-1β i.v. Values are means ± SEM. Pooled data of two independent experiments are shown. (I) IL-1β (30 µg/kg) influence on locomotor activity of Nestin-Cre × Tak1Fl/Fl mice and control Tak1Fl/Fl mice (n = 8 per group). The ratio of the activity of IL-1β and PBS injected animals in the dark phase is shown. Values are means ± SEM.

